テストの点数が、学習の安定した、予測可能な上昇の軌跡を示さないことがある。これは学習者を失望させ、教師は「何がいけなかったのか」と考え込んでしまいます。ニューヨークのある教師は、「この1年間、指導や練習をしたのに、どうして昨年より低い点数の生徒がいるのだろう。意味がわからない!」なぜ学習者のスコアが昨年より下がったのか?

Sometimes test scores don’t reveal a steady, predictable upward trajectory in learning. This can be disappointing for learners and can leave teachers wondering what “went wrong.” One teacher in New York commented, “How can I have students who scored lower than last year after having this full year of instruction and practice? It doesn’t make sense!”
テストの点数が、学習の安定した、予測可能な上昇の軌跡を示さないことがある。これは学習者を失望させ、教師は「何がいけなかったのか」と考え込んでしまいます。ニューヨークのある教師は、「この1年間、指導や練習をしたのに、どうして昨年より低い点数の生徒がいるのだろう。意味がわからない!」とコメントしていました。
U-Shaped Behavior(U字型の行動過程)
Scores that seem to regress or go down from one testing period to another are not particularly uncommon. In fact, it’s completely normal to see language increase or decrease slightly from year to year despite practicing and having more exposure to the language. In second language acquisition, this phenomenon is referred to as a U-shaped behavior or the U-shaped course of development (Ellis, 1997).
あるテスト期間から別のテスト期間へとスコアが後退したり、下がったりすることは、特に珍しいことではありません。実際、練習を重ね、その言語に触れる機会が増えているにもかかわらず、年ごとに言語が少しずつ増えたり減ったりするのは、まったく普通のことなのです。第二言語習得において、この現象はU字型行動またはU字型発達過程と呼ばれています(Ellis, 1997)。
Essentially, you may see a learner’s proficiency drop off temporarily but then return to their prior level. The literature explains this behavior as “reorganization of prior knowledge” – in other words, this is a stage where learners are attempting to practice or interpret a new linguistic form – they’re perhaps analyzing, listening, or applying language in new ways, maybe overthinking certain things they thought they ‘knew’ in the language.
基本的に、学習者の能力が一時的に低下しても、また以前のレベルに戻ることがあります。つまり、学習者が新しい言語形式の練習や解釈を試みている段階であり、新しい方法で言語を分析したり、聞いたり、適用したりしていることがあります。もしかしたら、その言語で「知っている」と思っていたこと考えすぎていたのかもしれません。
Teachers may have thought learners had already mastered that form, for instance. But while students practice using it in new or more developed ways (whether in speaking, listening, reading or writing), it may look like they don’t have mastery of the form after all. This actually reflects growth of mastery: learning to identify, interpret, or use the form in broader, more developed, or more advanced contexts and ways.
例えば、教師は学習者がすでにその形式をマスターしていると思っていたかもしれません。しかし、学習者が新しい、またはより発展した方法(スピーキング、リスニング、リーディング、ライティングのいずれにおいても)でその形式を使う練習をしている間、最終的にその形式をマスターしていないように見えるかもしれません。つまり、より広い、より発展した、より高度な文脈や方法で、その形を識別、解釈、または使用することを学ぶのです。
According to Ellis, “It is clear that this occurs because learners reorganize their existing knowledge to accommodate new knowledge” (23). This reorganization is also sometimes called restructuring (Young 9; Shirai 8). When learners appear to regress while learning about and attempting to practice a new linguistic form, they are progressing, even if they initially seemed to have “acquired” the form (Ellis 23).
Ellis氏によれば、「学習者が新しい知識に対応するために、既存の知識を再編成するためであることは明らかである」(23)。この再編成はリストラクチャリングと呼ばれることもある(Young 9; Shirai 8)。学習者が新しい言語形式を学び、実践しようとしている間に後退しているように見える場合、最初はその形式を「習得」したように見えたとしても、学習者は進歩しているのです(Ellis 23)。
Developing Proficiency Is Rarely Linear(言語運用能力の向上は直線的ではありません)
Additionally, the ACTFL Proficiency Guidelines – 2024 provide insight into the nature of developing language proficiency (emphasis added):
さらに、ACTFL Proficiency Guidelines – 2024(2024年版)は、言語能力の発達の本質に関する洞察を示している(強調):
“The Guidelines characterize the development of language proficiency as a continuum with five major levels. Each level represents a range of ability (what an individual can do with language) that includes all of the prior levels. The primary distinction between levels is the functions and tasks (F) that an individual at that level can accomplish. With effort and exposure to the language over time, an individual develops the degree of accuracy (A) and control of context and content (C) and text type (T) that are required to accomplish increasingly complex functions and tasks.
「本ガイドラインは、言語運用能力の発達を5つの主要レベルを持つ連続体として特徴づけています。各レベルは、それ以前のすべてのレベルを含む能力の範囲(個人が言語を使ってできること)を表しています。レベル間の主な違いは、そのレベルにある個人が達成できる機能とタスク(F)です。努力を重ね、時間をかけて言語に触れることで、個人は、次第に複雑になっていく機能やタスクを達成するために必要な正確さ(A)、文脈や内容(C)、テキストタイプ(T)のコントロールの度合いを身につけていきます。
The sublevels indicate how well the individual meets the criteria for the major level, and how close the individual’s proficiency is to sustaining the criteria for the next major level. This subdivision thus reflects the fact that over time and with practice an individual’s proficiency takes on the characteristics of the next higher level” (ACTFL, 2024).
サブレベルは、メジャーレベルの基準をどの程度満たしているか、また次のメジャーレベルの基準をどの程度維持できるかということを示します。この細分化は、時間の経過と練習によって、個人の運用能力が次の上位レベルの特徴を持つようになることを反映しています」(ACTFL, 2024)。
As development of language skills doesn’t always track in an “upward” and linear fashion, sometimes test scores don’t change from one year to the next or even regress from year to year. This, too, is not an uncommon pattern.
言語能力の発達は必ずしも「右肩上がり」で直線的に進むとは限らないため、テストのスコアがある年から次の年へ変化しない、あるいは年ごとに後退することもあります。これも珍しいパターンではありません。
Look at the Big Picture(全体像を見ましょう)
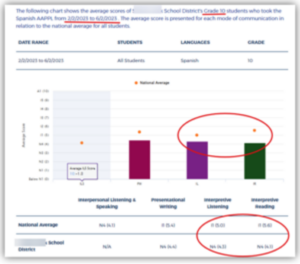
Remember, however, when looking at scores to evaluate what’s going on both with individual students as well as with your classes as a whole. Sometimes one or two learners may have declining or unchanged scores, but the average across your class or the school may be different. With AAPPL reporting tools, you can look at scores from year to year. For example, you might look at scores overall from last year’s 9th graders to this year’s 10th graders. Assuming this is largely the same group of students from one year to the next, you can get a sense of whether scores are increasing, decreasing, or staying the same. Looking at average scores in 2022 for 9th graders to average scores in 2023 for 10th graders (assuming the same group of students continued in the language program) can give you a picture of how your school’s average scores relate across years and to national averages (see examples below). While some specific learners’ scores may not have changed from one year to the next, looking at overall averages just might give a different picture.
しかし、点数を見るときには、個々の生徒だけでなく、クラス全体の状況を評価することを忘れないでください。1人または2人の生徒のスコアが低下していたり、横ばいであっても、クラスや学校全体の平均は異なることがあります。AAPPLのレポートツールを使えば、年ごとのスコアを見ることができます。例えば、昨年の9年生と今年の10年生の全体の点数を見ることができます。ある年から次の年まで、ほぼ同じ生徒集団であると仮定すれば、点数が上昇しているのか、下降しているのか、あるいは変わらないのか を知ることができます。2022年の9年生(中学3年生)の平均点と2023年の10年生(高校1年生)の平均点(同じグループの生徒が引き続き語学プログラムを受講していると仮定)を比較すると、学校の平均点が年度や全国平均とどのように関連しているかを把握することができます(以下の例を参照)。特定の学習者のスコアはある年から次の年まで変わっていないかもしれませんが、全体的な平均を見ることで、異なるイメージが得られるかもしれません。

References
ACTFL. (2024). ACTFL proficiency guidelines 2024. Alexandria, VA: American Council on the Teaching of Foreign Languages. Retrieved from https://www.actfl.org/uploads/files/general/Resources-Publications/ACTFL_Proficiency_Guidelines_2024.pdf
Ellis, Rod. Second Language Acquisition. Oxford, 1997.
Shirai, Yaauhiro. “U-shaped Behavior in L2 Acquisition.” Burmeister, H. y Rounds, LP (eds.) (1990).
Young, Richard. “Discontinuous interlanguage development and its implications for oral proficiency rating scales.” Applied Language Learning 6 (1995): 13-26.


